InfoVis-Projects
-
Abstract
This paper presents a multitouch vocabulary for interacting with parallel coordinates plots on wall-sized displays. The gesture set relies on principles such as two-finger range definition, a functional distinction of background and foreground for applying the Hold-and-Move concept to wall-sized displays as well as fling-based interaction for triggering and controlling long-range movements. Our implementation demonstrates that out-of-reach problems and limitations regarding multitouch technology and display size can be tackled by the coherent integration of our multitouch gestures. Expert reviews indicate that our gesture vocabulary helps solving typical analysis tasks that require access beyond the physical range of interaction and show how frequently our interactions were used.
Publication
Reibert, J., Riehmann, P., Froehlich, B.
Multitouch Interaction with Parallel Coordinates on Large Vertical Displays
In Proceedings of the ACM on Human-Computer Interaction 4, ISS, Article 199,
November 2020.
Preprint, Video -
Abstract
This paper presents a visual analytics system for exploring, analyzing and comparing argument structures in essay corpora. We provide an overview of the corpus by a list of ArguLines which represent the argument units of each essay by a sequence of glyphs. Each glyph encodes the stance, the depth and the relative position of an argument unit. The overview can be ordered in various ways to reveal patterns and outliers. Subsets of essays can be selected and analyzed in detail using the Argument Unit Occurrence Tree which aggregates the argument structures using hierarchical histograms. This hierarchical view facilitates the estimation of statistics and trends concerning the progression of the argumentation in the essays. It also provides insights into the commonalities and differences between selected subsets. The text view is the necessary textual basis to verify conclusions from the other views and the annotation process. Linking the views and interaction techniques for visual filtering, studying the evolution of stance within a subset of essays and scrutinizing the order of argumentative units enable a deep analysis of essay corpora. Our expert reviews confirmed the utility of the system and revealed detailed and previously unknown information about the argumentation in our sample corpus.
Publication
D. Kiesel, P. Riehmann, H. Wachsmuth, B. Stein and B. Froehlich, Visual Analysis of Argumentation in Essays. IEEE Transactions on Visualization and Computer Graphics, vol. 27, no. 2, pp. 1139-1148, Feb. 2021
Preprint, Video -
Abstract
This paper presents a short-contact multitouch vocabulary for interacting with scatterplot matrices (SPLOMs) on wall-sized displays. Fling-based gestures overcome central interaction challenges of such large displays by avoiding long swipes on the typically blunt surfaces, frequent physical navigation by walking for accessing screen areas beyond arm’s reach in the horizontal direction and uncomfortable postures for accessing screen areas in the vertical direction. Furthermore, we make use of the display’s high resolution and large size by supporting the efficient specification of two-tiered focus + context regions which are consistently propagated across the SPLOM. These techniques are complemented by axis-centered and lasso-based selection techniques for specifying subsets of the data. An expert review as well as a user study confirmed the potential and general usability of our seamlessly integrated multitouch interaction techniques for SPLOMs on large vertical displays.
Talks EuroVis 2020
Publication
Riehmann, P., Molina Leon, G., Reibert, J., Echtler, F., Froehlich, B. Short-Contact Touch-Manipulation of Scatterplot Matrices on Wall Display COMPUTER GRAPHICS Volume 39 (2020) Number 3.
Presented at the 22th EG/VGTC Conference on Visualization (EUROVIS) 2020.
Preprint, Talk EuroVis 2020 Video -
Abstract
We present an interactive visualization aiding users in making informed decisions about large product data sets consisting of quantitative and categorical attributes. Our approach tries to overcome common problems between parallel attribute axes, for instance limited horizontal space or clutter, by introducing novel visual concepts such as proxy axes, fusion axes, and hybrids of set-based and individual axis connections.
A proxy axis represents a group of semantically related attributes, which can be interactively explored and seamlessly integrated into the display. Fusion axes allow users to reduce the number of axes by merging categorical+categorical or categorical+quantitative attribute axes. Set-based or individual connections between axis pairs are chosen according to the involved attribute types. The pilot study and expert reviews showed that these novel concepts are understood, considered to be very useful and favored over up-to-date webshop interfaces.
Talks EuroVis 2020
Publication
Riehmann, P., Schädler, A., Harder, J., Herpel, J., Froehlich, B. Configuration Finder: A Tidy Visual Interface for Effective Faceted Search Proceedings of the 22th EG/VGTC Conference on Visualization (EUROVIS) 2020.
Preprint, Video, Talk EuroVis 2020 -
Abstract
This paper presents a visualization framework that aids readers in understanding and analyzing the contents of medium-sized text collections that are typical for the opus of a single or few authors. We contribute several document-based visualization techniques to facilitate the exploration of the work of the German author Bazon Brock by depicting various aspects of its texts, such as the TextGenetics that shows the structure of the collection along with its chronology. The ConceptCircuit augments the TextGenetics with entities - persons and locations that were crucial to his work. All visualizations are sensitive to a wildcard-based phrase search that allows complex requests towards the author’s work. Further development, as well as expert reviews and discussions with the author Bazon Brock, focused on the assessment and comparison of visualizations based on automatic topic extraction against ones that are based on expert knowledge.
Publication
Riehmann, P., Kiesel, D., Kohlhaas, M., Froehlich, B. Visualizing a Thinker’s Life IEEE Transactions on Visualization and Computer Graphics, vol. 25, no. 4, pp. 1803-1816, 1 April 2019.
Preprint, Video -
Abstract
We developed a scalable visual analytics framework for managing and analyzing hundreds of geographically distributed photovoltaic systems. These systems deliver performance parameters at different levels as well as environmental parameters. Our web-based framework gathers the data in a central server and allows comparisons of production values across time and photovoltaic systems, analysis of component failures and reporting errors. It is in daily use by a regional energy provider for over one year and its capabilities for fluent interaction and versatile configuration of visualizations from overviews to performance parameters of detailed components of individual systems are highly appreciated.
Publication
Harder, J., Riehmann, P., Woelfel, S., Krause, T., Froehlich, B. Visual Monitoring of Photovoltaic Systems EnvirVis 2016, Groningen, The Netherlands, June 2016.
-
Abstract
We present novel direct-touch centered paradigms for exploring time series data visualized in a coordinated multi-view display. The views can be easily and flexibly configured by choosing from various adapted or enhanced time-oriented visualizations. A vocabulary of robust direct-touch gestures enables the user to create, filter, derive, and focus on subsets of time-oriented data within the temporal dimension as well as the (data) records dimension. Our two-dimensional Focus&Context technique works particularly well with our extension to horizon graphs, which enables interactive scaling from area charts to multiple folded Horizon Graphs down to pixel-based visualizations and back.
Publication
Riehmann, P., Reibert, J., Opolka, J., Froehlich, B. Touch the Time: Touch-Centered Interaction Paradigms for Time-Oriented Data To appear in Proceedings of the 20th EG/VGTC Conference on Visualization (EUROVIS) 2018.
Preprint, Video -
Abstract
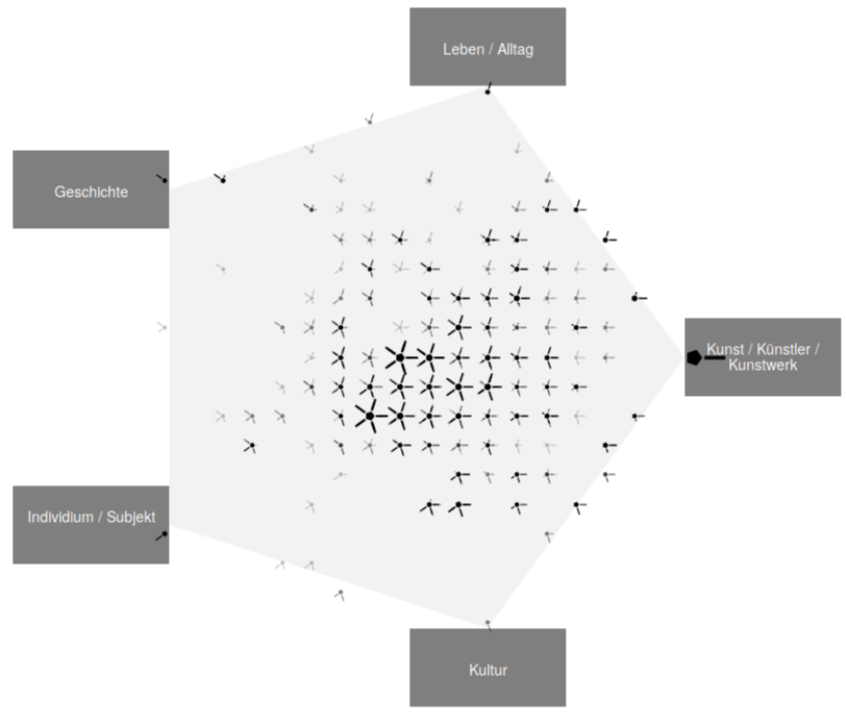
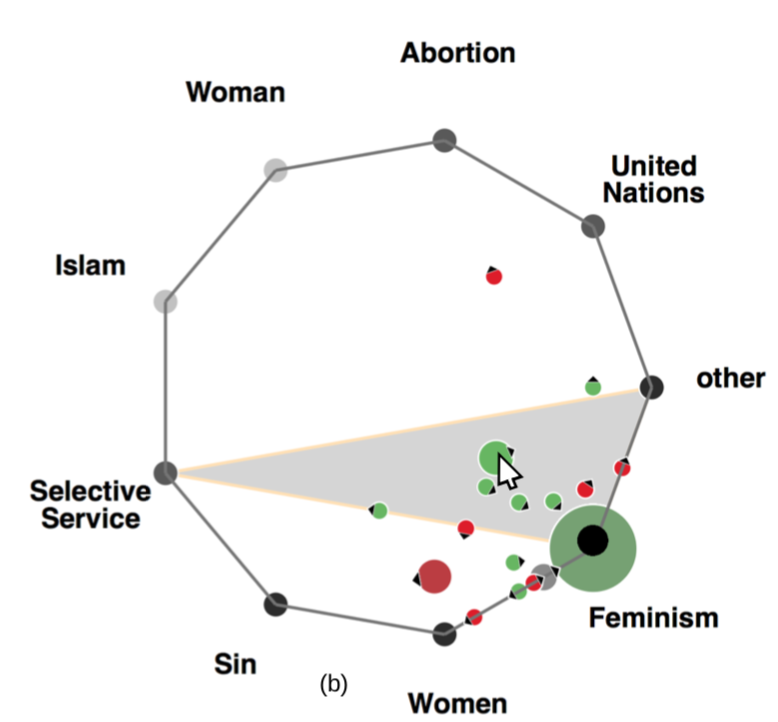
Topic modeling algorithms such as Latent Dirichlet Allocation (LDA) typically represent documents as a weighted combination of topics. Therefore, generalized barycentric coordinates are a natural fit for the visualization of a topic space. However, spatial positions in a planar barycentric coordinate system are ambiguous for more than three coordinates. Our glyphs for representing documents in combination with layout guidelines help to reduce the positional ambiguity. With an increasing number of documents, barycentric coordinate embeddings suffer from overplotting and visual clutter like other embeddings, possibly even more so since document po- sitions are fully independent of each other. Our experiments with jittering, aggregating glyphs, and grids show potential to reduce these problems for barycentric and other layouts.
Publications
Kiesel, D., Riehmann, P., Fan, F., Ajjour, Y., Wachsmuth, H., Stein. B., Froehlich, B. Improving Barycentric Embeddings of Topics Spaces (Poster) Proceedings IEEE VIS 2018, Berlin, Germany, October 2018
Preprint PosterAjjour, Y., Wachsmuth, H., Kiesel, D., Riehmann, P., Fan, F., Castiglia, G., Adejoh, R., Froehlich, B., Stein, B. Visualization of the Topic Space of Argument Search Results in args.me Proceedings of the 2018 Conference on Empirical Methods in Natural Language Processing (EMNLP), pp. 60-65, Brussels, Belgium, November 2018.
Preprint -
Abstract
HistoGlobe is an interactive historical geographic information system (HGIS) that provides students with gathered and curated historical information for self-study and aids teachers during history classes. The system visually integrates temporal and spatial aspects of historical events, as well as affiliations and alliances of states, routes of historic people and groups, and finally, detailed multimedia information. HistoGlobe relies on familiar interfaces such as globes and timelines but augments them with new techniques including directly manipulable moving entities such as troops and a direction-preserving presentation of treaties and other collaborations based on routing lenses. A field study with 12th graders revealed an overall solid usability of the system and inspired the development of further features.
Publication
Kossatz, M., Utzig, S., Schneegans, S., Lauer F., Westphal, T., Geelhaar, J., Froehlich, B., Riehmann, P. HistoGlobe: Teaching History Visually In Proceedings of the 12th International Joint Conference on Computer Vision, Imaging and Computer Graphics Theory and Applications - Volume 3: IVAPP, (VISIGRAPP 2017) ISBN 978-989-758-228-8, pp. 201-208. Preprint, Video
-
Abstract
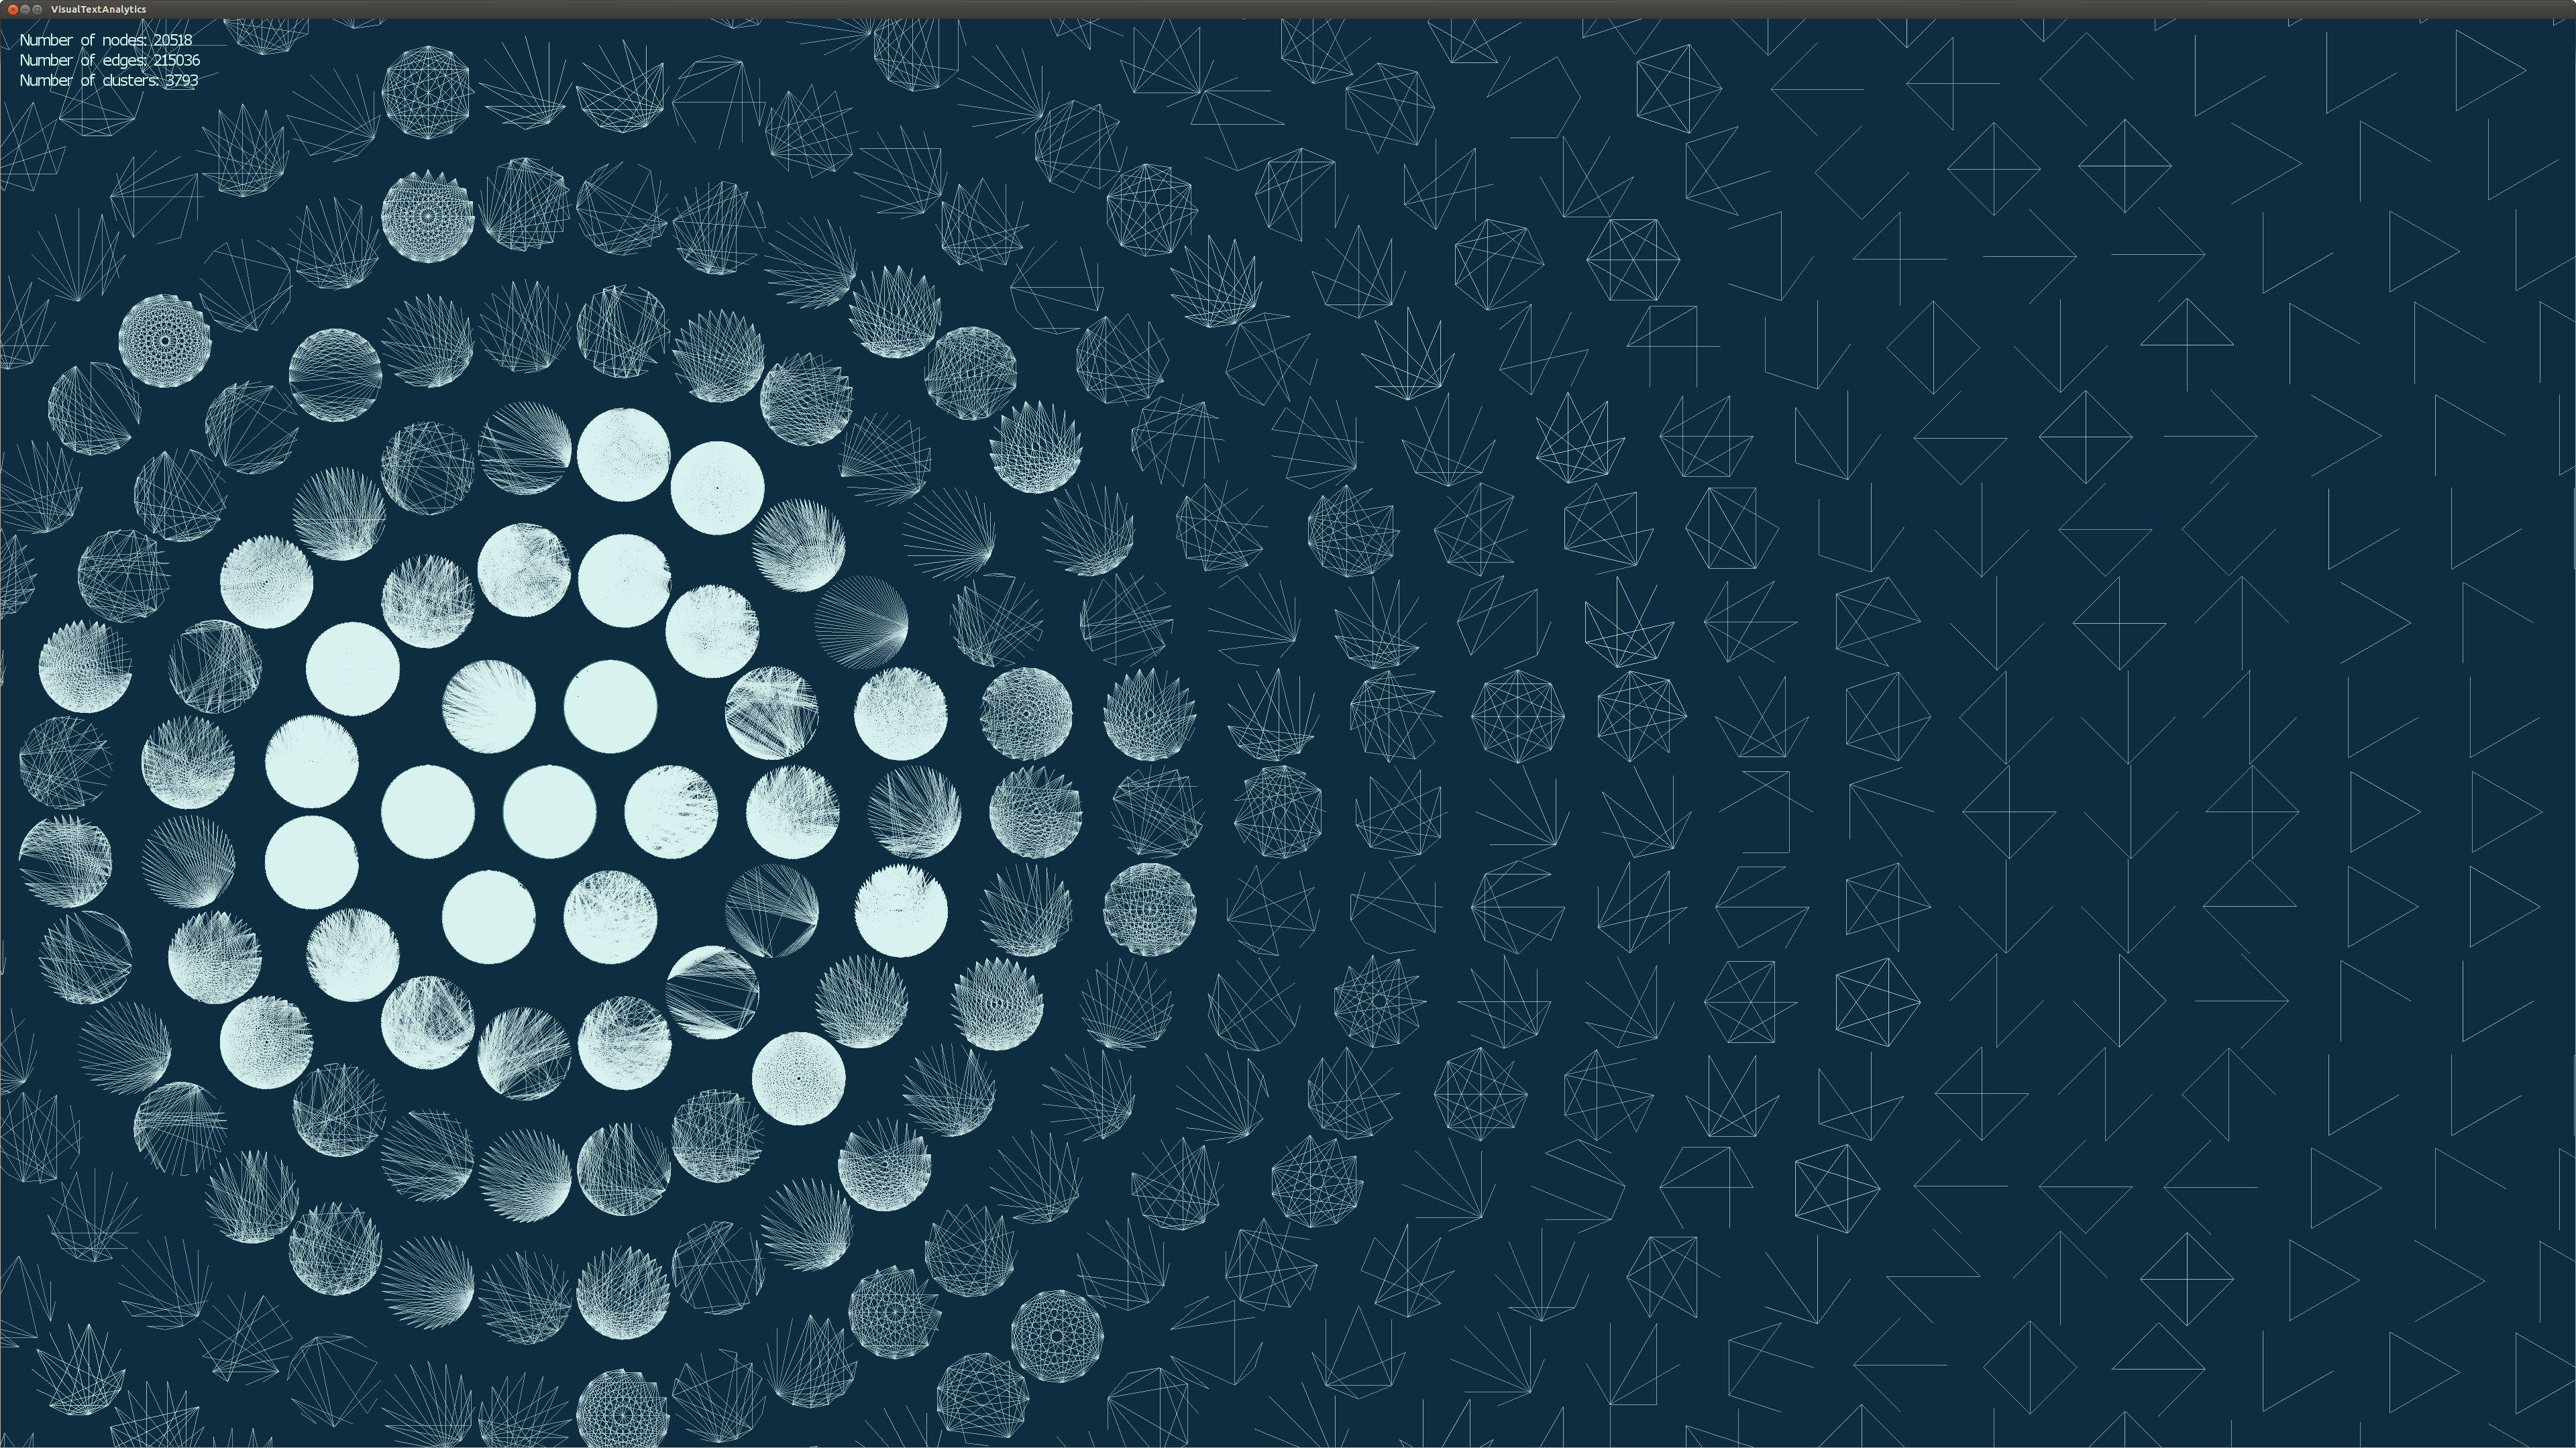
We present intermediate results regarding visual text analytics on Wikipedia. We implemented a visualization providing insight about similarities among Wikipedia articles in terms of structure as well as content. The presented data was gathered and processed via a pairwise comparison of all Wikipedia articles. Comparisons were appropriately pruned due to time and memory reasons when providing our in-memory database with the computed similarity values for visualization.
Publication
Patrick Riehmann, Martin Potthast, Henning Gruendl, Johannes Kiesel, Dean Jürges, Giuliano Castiglia, Bagrat Ter-Akopyan, Bernd Froehlich Visualising Article Similarities in Wikipedia (Poster, Honorable Mention Award) Proceedings EuroVis 2016, Groningen, The Netherlands, June 2016.
Preprint -
Abstract
We present a natural extension of two-dimensional parallel-coordinates plots for revealing relationships in time-dependent multi-attribute data by building on the idea that time can be considered as the third dimension. A time slice through the visualization represents a certain point in time and can be viewed as a regular parallel-coordinates display. A vertical slice through one of the axes of the parallel-coordinates display would show a time-series plot. For a focus-and-context integration of both views, we embed time-series plots between two adjacent axes of the parallel-coordinates plot. Both time-series plots are drawn using a pseudo three-dimensional perspective with a single vanishing point. An independent parallel-coordinates panel that connects the two perspectively displayed time-series plots can move forward and backward in time to reveal changes in the relationship between the time-dependent attributes. The visualization of time-series plots in the context of the parallel-coordinates plot facilitates the exploration of time-related aspects of the data without the need to switch to a separate display. We provide a consistent set of tools for selecting and contrasting subsets of the data, which are important for various application domains.
Publication
Gruendl, H., Riehmann, P., Pausch, Y., Froehlich, B. Time-Series Plots Integrated in Parallel-Coordinates Displays COMPUTER GRAPHICS forum ,Volume 35 (2016), Number 3 (to appear), EuroVis 2016, Groningen, The Netherlands, June 2016.
Preprint, Video -
Abstract
We developed a scalable visual analytics framework for managing and analyzing hundreds of geographically distributed photovoltaic systems. These systems deliver performance parameters at different levels as well as environmental parameters. Our web-based framework gathers the data in a central server and allows comparisons of production values across time and photovoltaic systems, analysis of component failures and reporting errors. It is in daily use by a regional energy provider for over one year and its capabilities for fluent interaction and versatile configuration of visualizations from overviews to performance parameters of detailed components of individual systems are highly appreciated.
Publication
Patrick Riehmann , Martin Potthast, Benno Stein, Bernd Froehlich
Visual Assessment of Alleged Plagiarism Cases
COMPUTER GRAPHICS forum ,Volume 34 (2015), Number 3
Presented at EuroVis 2015, Cagliari, Italy, May 2015
Preprint, Video -


Abstract
We present a system for visualizing food ingredients with a glyph-based approach aimed at children between the ages of four and eight, approximately. The intention is to visually explain and to visually argue that a certain food a child is eager to eat is healthy or, more often, is not healthy. Therefore, we introduced two comic-like characters whose shape and features depend on the main ingredients of food products. These characters can be directly displayed on a parent’s smartphone by scanning the barcode of a food product. Our study showed that children are able to recognize several ingredient manifestations encoded as visual attributes and thus to consider a food product as being healthy or not.
Publication
Patrick Riehmann, Wieland Möbus, Bernd Froehlich Visualizing Food Ingredients for Kids by Utilizing Glyph-Based Characters In Proceedings of the 12th International Working Conference on Advanced Visual Interfaces (AVI ‘14). ACM, Como, Italy, May 27-30, 2014
DOI Preprint -
Abstract
The WORDGRAPH helps writers in visually choosing phrases while writing a text. It checks for the commonness of phrases and allows for the retrieval of alternatives by means of wildcard queries. To support such queries, we implement a scalable retrieval engine, which returns high-quality results within milliseconds using a probabilistic retrieval strategy. The results are displayed as WORDGRAPH visualization or as a textual list. The graphical interface provides an effective means for interactive exploration of search results using filter techniques, query expansion and navigation. Our observations indicate that, of three investigated retrieval tasks, the textual interface is sufficient for the phrase verification task, wherein both interfaces support context-sensitive word choice, and the WORDGRAPH best supports the exploration of a phrases context or the underlying corpus. Our user study confirms these observations and shows that WORDGRAPH is generally the preferred interface over the textual result list for queries containing multiple wildcards.
Publication
Riehmann, P., Gruendl, H., Potthast, M., Trenkmann, M., Stein, B., Froehlich, B. WORDGRAPH: Keyword in Context Visualization for NETSPEAK’s Wildcard Search IEEE Transactions on Visualization and Computer Graphics, pp. 1411-1423, Sept., 2012
Preprint, VideoRiehmann, P., Gruendl, H., Froehlich, B., Potthast, M., Trenkmann, M., Stein, B. The NETSPEAK WORDGRAPH: Visualizing Keywords in Context IEEE Pacific Visualization Symposium 2011, Hong Kong, March 2011. Best Paper Award
Preprint, -
Abstract
We present the Product Explorer, an interactive parallel coordinates display for facilitating the selection process of products with many attributes. Users can quickly narrow down the product search to a small subset or even a single product by using our visual query interface. In contrary to typical webshop interfaces and product search websites our system keeps the users well informed throughout the entire product selection process. All products and important attributes are visible at a glance and all the time. All interactions can be performed with immediate feedback and users do not have to wait until a query response appears.
Publication
Patrick Riehmann ,Jens Opolka, Bernd Froehlich The Product Explorer: Decision Making with Ease In Proceedings of the International Working Conference on Advanced Visual Interfaces (AVI), Capri, Italia, pp423-432, May 2012
Preprint, Video -
Abstract
We present a system that allows users to interactively explore complex flow scenarios represented as Sankey diagrams. Our system provides an overview of the flow graph and allows users to zoom in and explore details on demand. The support for quantitative flow tracing across the flow graph as well as representations at different levels of detail facilitate the understanding of complex flow situations.
The energy flow in a city serves as a sample scenario for our system. Different forms of energy are distributed within the city and they are transformed into heat, electricity, or other forms of energy. These processes are visualized and interactively explored. In addition our system can be used as a planning tool for the exploration of future scenarios by interactively manipulating different parameters in the energy flow network.Publication
Patrick Riehmann, Manfred Hanfler, and Bernd Froehlich: Interactive Sankey Diagrams In Proceedings of the IEEE Symposium on Information Visualization (InfoVis 05), pp. 233-240, October 2005
Preprint, Slides, VideoScreenshots